Applications development projects are rarely planned accurately in such a way that plans may exactly predict what will happen during the process. It is important to monitor the project and consistently make changes to the plan or on the project activities. More ..

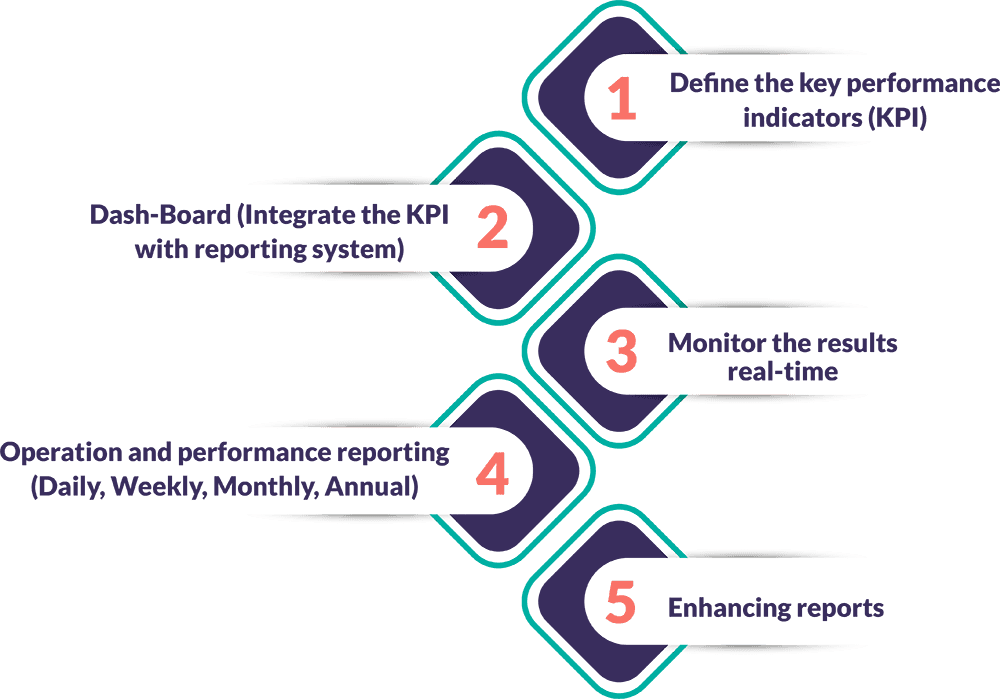
Define the Key Performance Indicators (KPI)
Measurement performance in software development is an extremely important task. Key Performance Indicator is the value that shows how effective software development in meeting the laid down goals and objectives. These parameters are used at multiple levels to evaluate the success at reaching the desired targets. Ideally, high-level KPIs focus on the overall business performance while the low levels focus on the processes and functional level. The main stages in the identification of key performance indicators include: putting in place pre-defined business process, the requirement for the business processes, taking qualitative and quantitative measures and making comparisons and finally investigating deviation and modifying the systems or processes to achieve the desired goals.
As a tool that is geared towards assessing the performance of a system, it must is defined in a way that is meaningful, understandable and meaningful. They ought to follow the SMART principle, where they should be Specific, Measurable, Achievable, Relevant and Time-bound. For evaluation, the KPIs need to be linked to targeting values to assess whether expectations are being met or not. At Noah Matrix, we will help in identification of the Key Performance Indicators and also put in place strong mechanisms through which ascertaining whether the objectives and goals of a given project or undertaking are being achieved.
When making a decision of which data need tracking, it is advisable to start by defining the specific business problem that requires a solution. Establish metric which is aligned to business strategies, then employ the right tools, the kind that offers KPI reporting tools and at the same time aligns with the activities and outcomes with relevant strategies. KPIs ought to be used for benchmarking, measuring business or project performance and progress.
Dash-Board (Integrate the KPI with reporting system)
Analyzing and reporting key business or project metric with a KPI dashboard that allows you to stay on top of performance is a crucial aspect of business development. With businesses today being overwhelmed by the amount of data it is becoming impossible to look at each single data point. There is a need to be strategic about the metrics being tracked. KPIs act as scorecards which allow prioritization and continuous monitoring to meet the business goals and objectives. KPIs give a framework where analysis, management of data can be done to achieve the desired results. They also provide an organization with insights on current performance. With data alerts, it is possible to notify the user automatically on any anomalies that would be overlooked. Integration with intelligent systems also provides an insight into the future performance which allows the business to staff focused on performance while also aiming at efficiency and effectiveness.
Selecting the right metrics can be a challenge, when you track too many metrics at the same time you may get a data overload with the whole process becoming unexplainable. You need to choose the right metrics if you are to get the right insights as well as work in the right KPI dashboards. Utilizing a powerful KPI tool makes work easy.
Monitor the results real-time
Once you have installed the right dashboard and managed to successfully integrate KPI with the reporting system, you will see an evolution in real-time. A user-friendly and smart tool allows you to visualize and share according to the business needs. With a well-designed data, analysis interface comes with an integrated dashboard that enables easy visualization and sharing with internal and external stakeholders. This also allows for real-time monitoring of results.
Operation and performance reporting (Daily, Weekly, Monthly, Annual)
With the professional dashboard tools, building own story from the data is enhanced. Monitoring and comparing KPIs in real-time basis and creation of geographical maps as well as dynamic reporting is made easy. With a variety of interactive elements, one can get performance and operation reports on a real-time basis; daily, weekly, monthly, quarterly and even annually.
Enhancing reports
It is also easy to generate enhanced reports, the kinds that provide an insight into a deeper level. With these tools enhancing reports is an easily achievable task, one that can be done with little effort.
At Noah Matrix, we help business collect their data and analyze using KPI dashboard. There are advantages which are linked with using performance indicators to manage business activities; the numbers provide a transparent and crucial overview of business performance. Business can uncover any critical issues, save time and costs, have a proper alignment of functions, consolidate and harmonize departments, put all metrics in one place and get into the depth of insights. With Noah Matrix dashboard, you will be able to connect everywhere and even work remotely as well as have shared access with other stakeholders. With such capabilities, duplication, conflicting versions, and synchronization will be adequately addressed.
